Water-quality data from satellites and field sensors.
My role
Lead Software Engineer, then Head of Software
When
2021–2024
Built with
Python, AWS Batch, S3, database table locks, Sentinel and Planet imagery, sensor data
Satellite imagery and water-quality maps in GybeMaps. Animation: Gybe.
The idea
Gybe combined satellite observations and ground sensors to help people understand water quality. GybeMaps brought those measurements into maps and time series that water managers could explore.
I joined as Lead Software Engineer, helped take a locally hosted beta into AWS production, and later became Head of Software. My work connected backend engineering and machine learning with the planning and delivery of the product.
Gybe’s projects spanned drinking water, habitat restoration, and agriculture.
City of Salem
Gybe monitored water quality to help protect the drinking-water supply in Salem, Oregon.
The Nature Conservancy
Gybe monitored water quality in Louisiana’s Mississippi River Delta to support ecological habitat restoration.
AB InBev
Gybe monitored irrigation water for barley growers along the Snake River in eastern Idaho.
My contribution was to the shared platform: moving GybeMaps into AWS production, building daily satellite-ingestion pipelines, and harmonizing sensor observations with satellite data. That work brought the measurements behind water-quality monitoring into maps and time series people could use.
Gybe’s multi-year Klamath River project combined satellite and field observations to monitor water quality around dam removal and river restoration.
During my time at Gybe, I built and maintained the platform that ingested and transformed the data and hosted the visualizations. The Planet satellite-data workflow operated with less than 24 hours of latency.
Gybe contributed to water-quality research with San Diego State University and researchers at NASA’s Jet Propulsion Laboratory (JPL/Caltech). The work combined Gybe field measurements with EMIT satellite spectroscopy to study wastewater in the Tijuana River Estuary.
The study used a Gybe sensor installed in 2022 and field measurements from 2023, during my time at the company. The research was published in 2025.
Gybe’s system included physical instruments as well as satellite processing and software. Its autonomous, above-water sensors measured light at the water surface. Field observations supported the calibration and validation of water-quality estimates alongside satellite data.
My work included bringing sensor data into the platform and harmonizing it with our satellite data. I also took part in field installation and calibration occasionally. That connected the software work to the practical conditions under which measurements were collected.
A Gybe sensor installed above the water surface.Field work at Detroit Lake. Photo: Gybe.
I built a pipeline for daily ingestion of Sentinel satellite data at terabyte scale, with processing dispatched as AWS Batch jobs. S3 provided persistent storage, while table locks coordinated concurrent work against shared database state.
Batch execution separated the expensive processing from the web application. The pipeline had to handle varying input volumes each day and coordinate workers updating shared state.
Sentinel observations
Daily ingestion discovered and brought in available satellite data.
AWS Batch
Processing ran as asynchronous batch jobs.
Amazon S3
Persistent storage kept the data separate from the lifetime of a worker.
Simplified component view. Database table locks coordinated work across concurrent processes. The daily ingestion schedule was separate from the satellites’ revisit schedules.
Coordinating workers and protecting shared state
Fault tolerance mattered because an interrupted worker or an overlapping run could affect a daily ingestion cycle. AWS Batch ran the processing jobs, while S3 kept stored data independent of worker lifetimes.
Database table locks coordinated processes updating shared state. The design question was where to require exclusive access and where to let expensive satellite processing run in parallel.
From observation to a useful answer
The product let users explore a waterbody geographically and over time. Satellite imagery gave a wider view, while sensor measurements added local observations. Maps and charts made changes easier to inspect.
The engineering work sat between those scientific inputs and the interface: ingesting observations, transforming them into useful measurements, and delivering them reliably to the application.
A map and measurements from multiple locations in one dashboard. Image: Gybe.
Maps
Users could explore water-quality information across a waterbody.
Time series
Users could inspect how measurements changed over time.
Combined data
The platform brought satellite and sensor observations into a shared workflow.
Recent measurements in context
The location detail view placed several water-quality parameters side by side. Historical series let users compare recent readings with previous years and see how they fit into a seasonal pattern.
Comparing measurements at Detroit Dam across years. Image: Gybe.
Locations over time
The Explorer connected a location on the map with its measurements over time. Users could choose a data layer, adjust the time window, and compare locations while keeping the geographic context in view.
Mapped locations alongside turbidity and suspended-matter time series. Image: Gybe.
What I worked on
I drove the move from a locally hosted beta to an AWS-backed production product serving an international customer base. I also built machine-learning models and ETL pipelines for terabyte-scale satellite ingestion and sensor-data integration.
As Head of Software, I led the roadmap and delivery across a distributed team while remaining a principal backend contributor.
Software, science, and field work
The platform depended on software engineers, water-quality scientists, and field deployment working together. Integrating sensors meant understanding how observations were collected as well as how they would appear in the product.
The Gybe team.
Research and publications
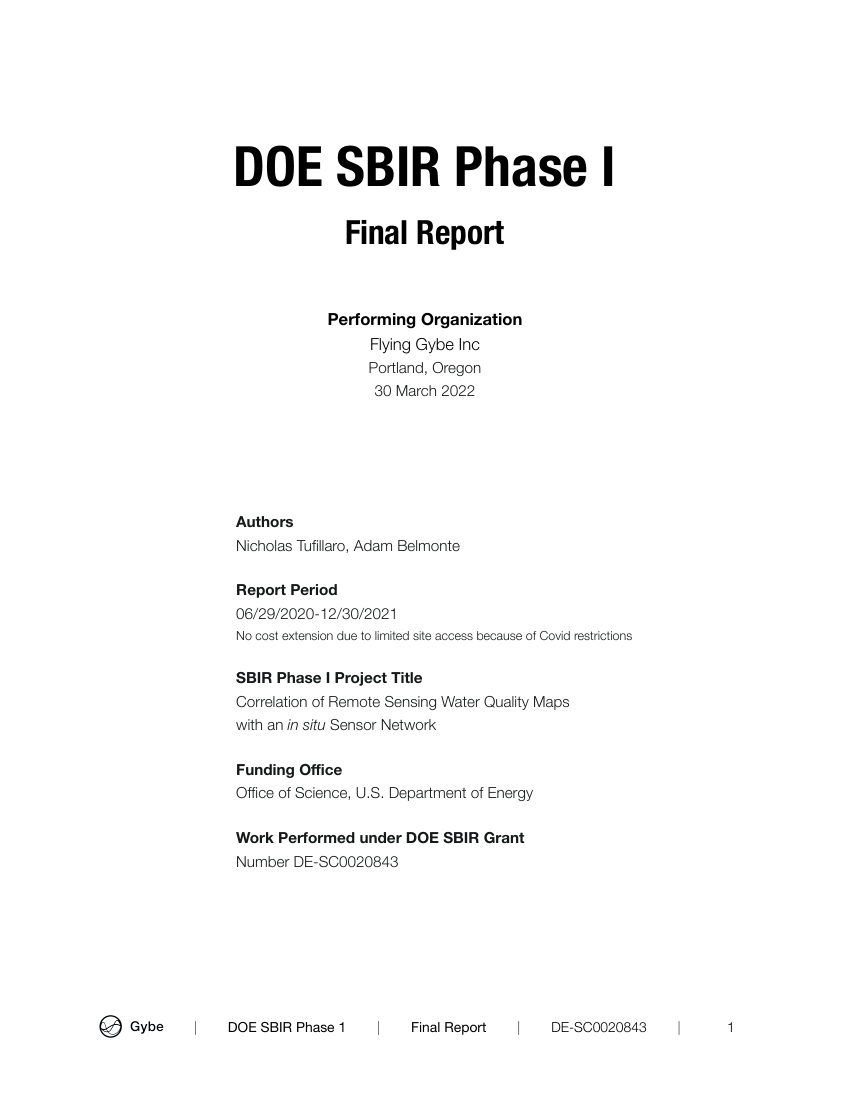
DOE SBIR Phase I · March 2022
Correlation of Remote Sensing Water Quality Maps with an in situ Sensor Network
By Nicholas Tufillaro and Adam Belmonte. A report connecting remote-sensing water-quality maps with field measurements.
I contributed to the preparation of this report and am credited in its acknowledgments.